# Report on deployments using Excel and XML
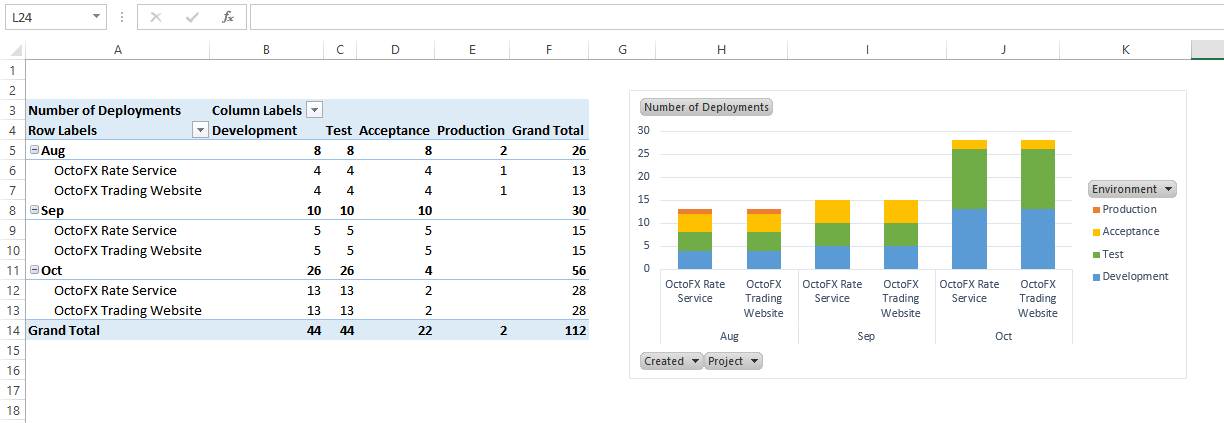
Ever wonder how many deployments you did this month? We'll help you answer this question by walking you through how to export your deployments to Excel, and how to view them in a pivot table.
At a high-level, the steps are:
1. Export all deployments to an XML file.
2. Import the XML file in Excel.
3. Report on the data using a pivot table.
:::figure
:::
## Export all deployments using the XML feed
Before we can report on the data using Excel, we need to export it in a format that Excel can import. The easiest way to do this is using an XML file.
Octopus exposes data on deployments through the `/api/reporting/deployments/xml` endpoint. You can use our [Octopus API clients](/docs/octopus-rest-api/getting-started#api-clients) to download the XML file.
PowerShell
```powershell
$octopusURL = "https://your-octopus-url"
$octopusAPIKey = "API-YOUR-KEY"
$header = @{ "X-Octopus-ApiKey" = $octopusAPIKey }
Invoke-RestMethod -Method Get -Uri "$octopusURL/api/reporting/deployments/xml" -Headers $header -OutFile "deployments.xml"
```
The command will produce an XML file with contents similar to the following:
```xml
Production
Web App
Deployment - Orchestration
2020-05-15T17:07:47
Deploy to Production
Deployments-4992
Production
All OctoPetShop
Deployment - Orchestration
2020-05-15T17:07:23
Deploy to Production
Deployments-4991
.....
```
This file is now ready to be imported into Excel.
## Import the XML file in Excel
Now that we have an XML file containing our deployments, we can import it into Microsoft Excel. In this example we are using Excel 2013.
1. Open Microsoft Excel, and create a new, blank workbook.
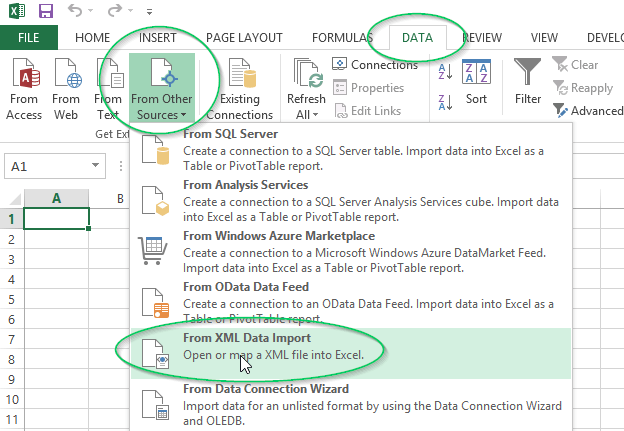
2. On the **Data** ribbon tab, click **From Other Sources**, then choose **From XML Data Import**.
3. Excel will prompt you that the XML file does not refer to a schema, and that one will be created. Click **OK**.
4. Excel will ask you where to create a table. Choose the location in your workbook to put the new table, or just click **OK**.
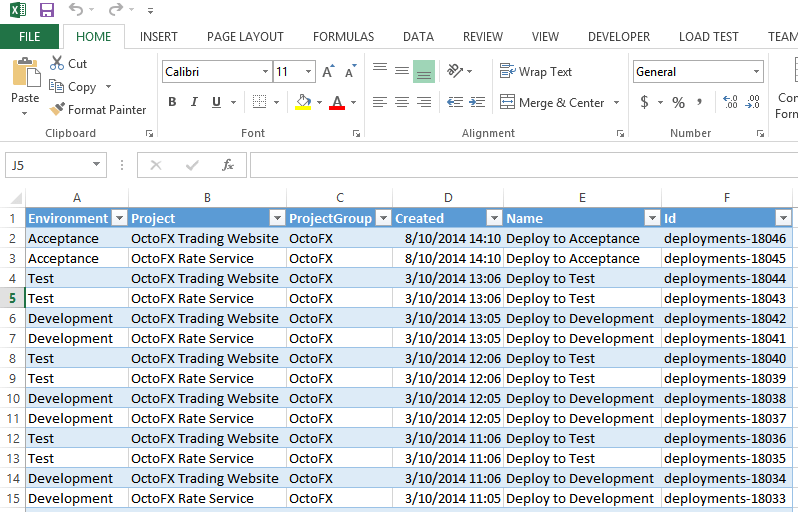
5. You should now have a table that lists each of the deployments you have performed with Octopus, along with the name of the environment, project and the date of the deployment.
## Report on the data using a pivot table
It's easy to turn the table of deployments into a pivot table for reporting.
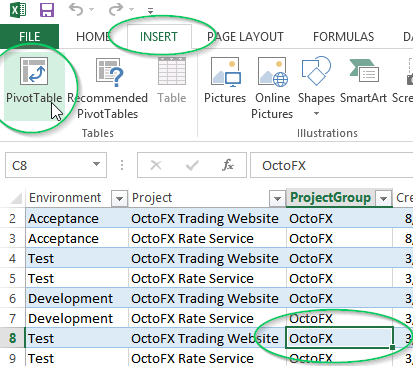
1. Select any cell in the table, then from the **Insert** ribbon tab, click **PivotTable**.
2. Excel will prompt you to ask where to place the new pivot table. Click **OK** to add it to a new worksheet in your workbook.
3. You can now build the pivot table by dragging fields into the **Rows** or **Columns** of the pivot table.
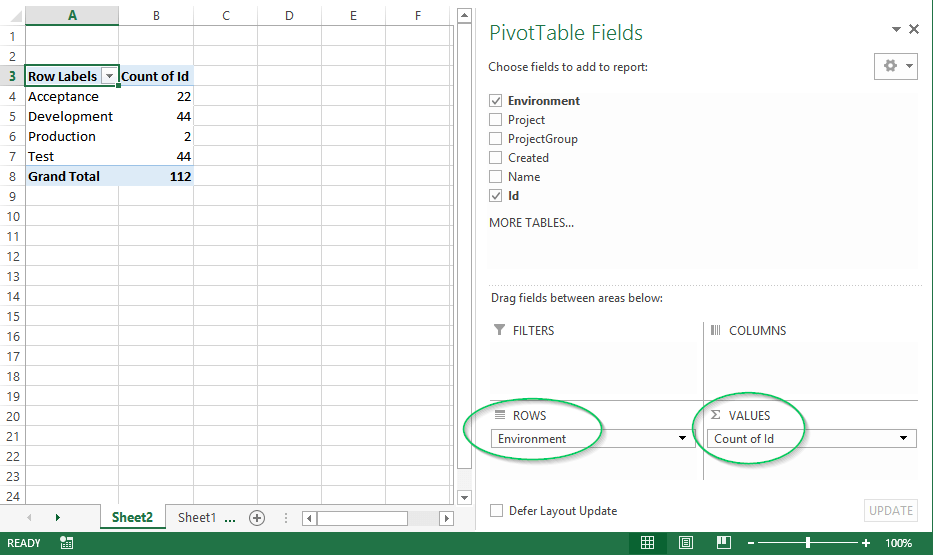
For example, here's a breakdown of deployments by environment. Note that the **Id** field was dragged to the **Values** area, and **Environment** was dragged to **Rows**.
:::figure
:::
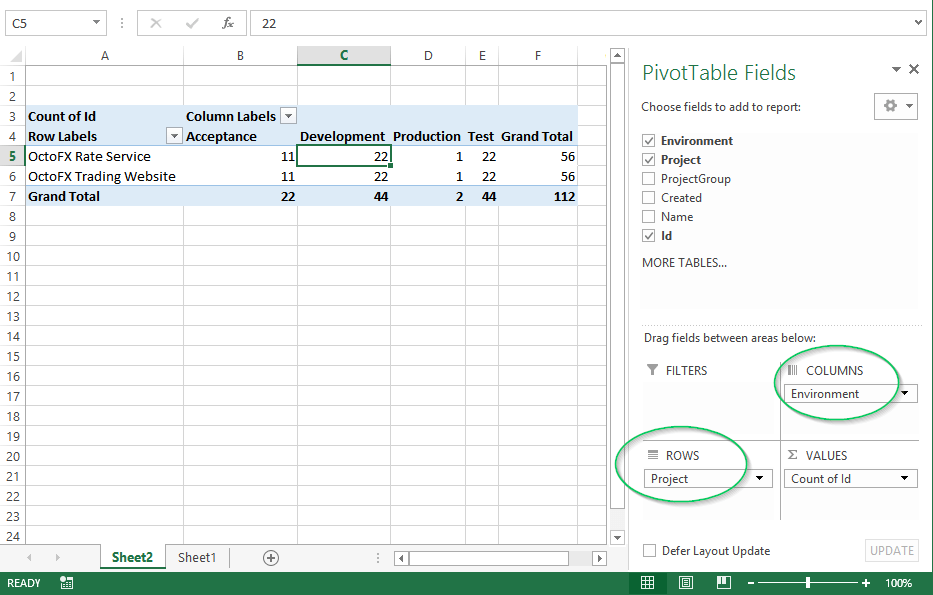
Here's another example, this time using **Environment** as a column, and **Project** as the rows:
:::figure
:::
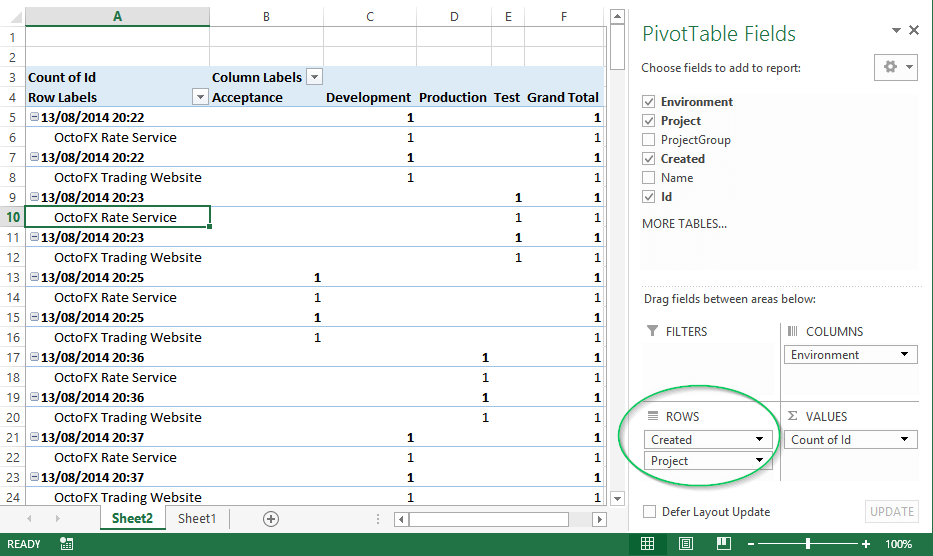
You can also group the results by month or other measures of time. First, drag the **Created** field as as row.
:::figure
:::
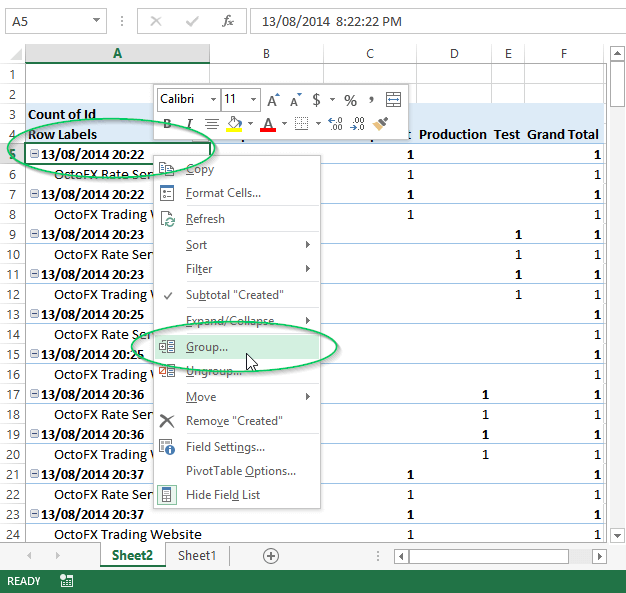
Now, right-click any of the date values, and click **Group**.
:::figure
:::
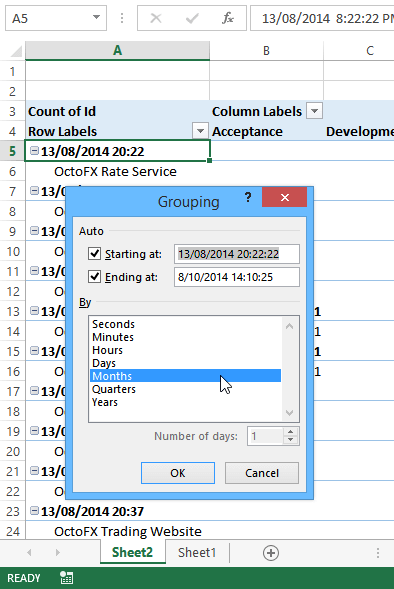
Choose the level of granularity that you want to group by, then click **OK**. In this example we chose Months.
:::figure
:::
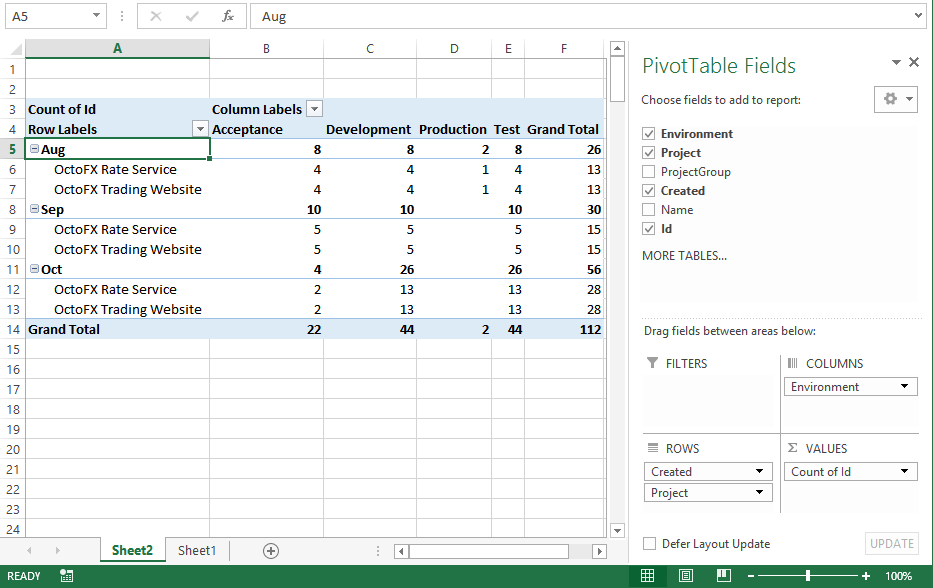
And the results will now be grouped by month:
:::figure
:::
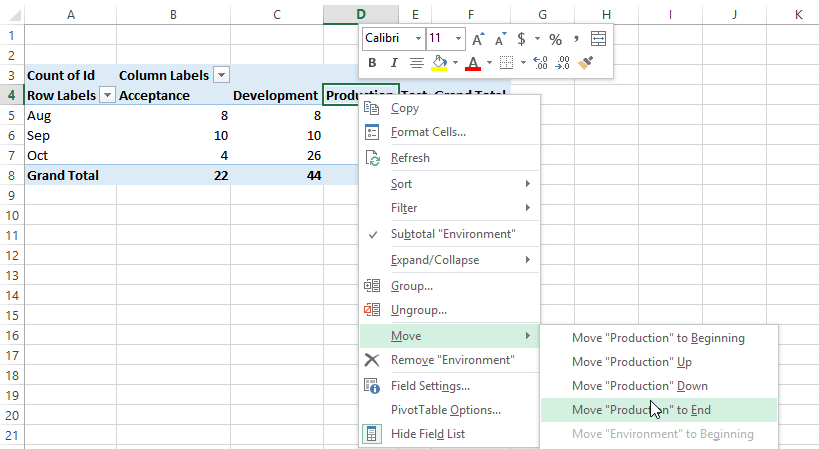
If you aren't happy with the order that environments or other items are shown in, you can right-click and move them:
:::figure
:::
Finally, don't forget to add pretty graphs!
:::figure

:::
:::div{.hint}
**Limitations**
There are two major limits to this approach to be aware of:
1. As you have seen, only a small amount of data is available for use for reporting.
2. If you use [retention policies](/docs/administration/retention-policies), releases and deployments that have been deleted by the retention policy will also not be available for reporting.
:::
## Learn more
- [Reporting blog posts](https://octopus.com/blog/tag/reporting/1).